The Same Local Python Setup in VS Code: A Step-by-Step Workflow
The Positron setup, now in Visual Studio Code: the same uv environment and project folder, cell-by-cell work in the Interactive Window, the exact settings file, tests with pytest and ruff, the problems we hit and how we fixed them, and project rules that keep real data off the cloud. Every example uses synthetic data.
What is this article about?
In the previous article we set up a local Python workflow in Positron. Here we run the same project, the same Python environment and the same code in Visual Studio Code (VS Code for short). VS Code is Microsoft's free code editor; it is already installed on many researchers' computers, and with a few extensions it works well for data analysis. Why two editors? Because the project folder and the .venv environment do not depend on the editor. Whichever one you open, you get the same files, the same packages and the same results. Another aim is to give people coming from RStudio a familiar layout: you run the code cell by cell, and results, tables and plots appear right beside the code. The examples use entirely synthetic (made-up) data. The numbers carry no scientific meaning; the aim is only to show the workflow.
Step 1: The project and the Python environment
We set up the environment with uv, as in the Positron article (uv is a fast command line tool that manages the Python version and packages; install it from docs.astral.sh/uv). If you do not have a project yet, create one with the commands there. For VS Code's interactive window we add three extra packages to the development group: ipykernel (the kernel that runs the Python session), notebook and pip. Having pip in the list may look odd, but there is a reason: uv environments do not come with pip, while VS Code's Jupyter extension looks for pip when it searches for a kernel. That is why we added pip as a development dependency.
uv add --dev ipykernel notebook pip pytest ruffStep 2: Install the extensions
VS Code on its own is only a text editor; for data analysis you need the extensions below. All of them can be found by searching in the Extensions pane (the square icon on the left bar): - Python (Microsoft): recognises Python files and handles environment selection and tests. - Pylance (Microsoft): code completion and type hints. - Jupyter (Microsoft): provides the Interactive Window that runs "# %%" cells and shows the results on the right. - Ruff (Astral): code checking and formatting. Optionally, Data Wrangler (Microsoft) helps with inspecting tables, and Cline can be used for code help with local models. We do not treat these two as required.
Step 3: Open the folder and put the settings in place
Use File, then Open Folder, and choose the project folder. If the folder contains a file named .vscode/settings.json, VS Code reads its settings from there; keeping this file with the project makes it easier to move the setup to another computer. In short, here is what the settings do. python.defaultInterpreterPath points to the project's .venv environment. python.testing.pytestEnabled and pytestArgs connect the tests to the Testing pane on the left bar. python.analysis.extraPaths tells Pylance about the functions in the src folder. jupyter.notebookFileRoot fixes the working folder of the cells to the project root, so relative paths such as "data/raw/ornek.csv" always point to the same place. creationMode "perFile" opens a separate interactive window for each file. The last block formats Python files with Ruff when you save. In the status bar at the bottom right, the environment name appears next to the Python version (ours shows "veri-analizi (3.12.13)"). If it is different, click it and select the project's .venv environment.
{
  "python.defaultInterpreterPath": "${workspaceFolder}\\.venv\\Scripts\\python.exe",
  "python.terminal.activateEnvironment": true,
  "python.testing.pytestEnabled": true,
  "python.testing.pytestArgs": ["tests"],
  "python.analysis.extraPaths": ["src"],
  "jupyter.notebookFileRoot": "${workspaceFolder}",
  "jupyter.interactiveWindow.textEditor.executeSelection": true,
  "jupyter.interactiveWindow.creationMode": "perFile",
  "[python]": {
    "editor.defaultFormatter": "charliermarsh.ruff",
    "editor.formatOnSave": true
  }
}
Step 4: Run the code cell by cell
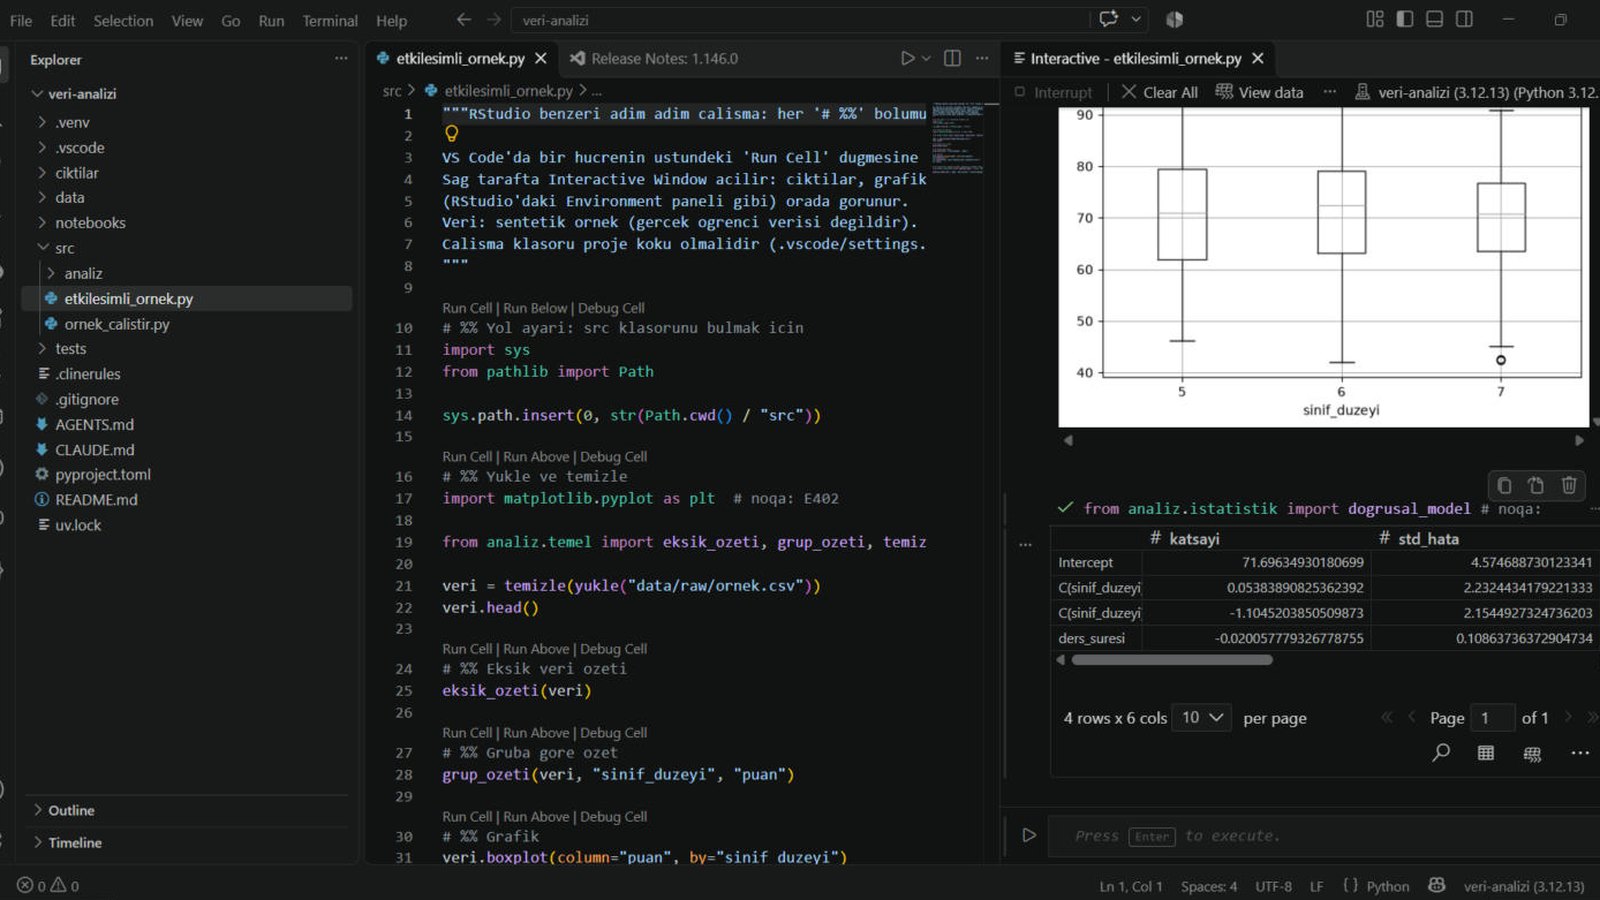
In the file, every line that starts with "# %%" opens a new cell. The Run Cell link above a cell runs only that block, and Shift+Enter does the same. On the first run VS Code starts the kernel and opens the Interactive Window to the right of the file. Outputs, tables and plots pile up there one below another. So loading, cleaning, summarising and plotting each live in their own cell, and when you change one step you do not have to rerun the whole script. In the example below, the first cell only adds the src folder to Python's path. If you see a "# noqa: E402" note on some imports in the file, do not be surprised: Ruff wants imports at the very top of the file, but we import after the path setup, so we silence that warning on purpose.
# %% Path setup: so Python can find the src folder
import sys
from pathlib import Path

sys.path.insert(0, str(Path.cwd() / "src"))

# %% Load and clean
from analiz.temel import eksik_ozeti, grup_ozeti, temizle, yukle

veri = temizle(yukle("data/raw/ornek.csv"))
veri.head()

# %% Missing data summary
eksik_ozeti(veri)

# %% Summary by group
grup_ozeti(veri, "sinif_duzeyi", "puan")

# %% Plot
veri.boxplot(column="puan", by="sinif_duzeyi")Step 5: Look at the table, the plot and the variables together
When you end a cell with a data table, the Interactive Window shows it in a view you can page through and search. Plots appear right below the code; in the screenshot above you see a box plot of score by grade level, and below it the output table of the linear model. In the top bar of the window, next to the Interrupt and Clear All buttons, there are buttons for looking at variables and the data table; their names may differ a little between extension versions. If you are looking for RStudio's Environment pane, this is its counterpart. In Positron these panes are ready in the main window, while in VS Code you open them from within the Interactive Window.
Step 6: A small model, tests and code checks
In the example project the statistics functions live in src/analiz/istatistik.py. The last cell of the interactive file calls a function that examines the association between score on the one hand and lesson duration and grade level on the other, using a linear model. The model is fitted with ordinary least squares (OLS), and the standard errors are computed in a way that is robust to unequal variances (HC3). The output table gives the coefficient, standard error, t and p values, and the confidence interval. Because the data is made up, these numbers say nothing. When we interpret such output in a real study, we speak of associations, not causation: finding an association between lesson duration and score does not mean that duration changes the score. A silent error in analysis code is more dangerous than a visible one, because the numbers look plausible. That is why we write small pytest tests for each helper function, using examples whose answer is known in advance. Because the pytest setting is on, the tests also appear in the Testing pane on the left bar, but running them from the terminal gives the same result. After changing code, both commands are run; if the tests do not pass, the analysis is not repeated.
uv run ruff check --fix .
uv run pytest
Where we got stuck, and how we fixed it
The setup may not go smoothly on every computer. Three things we ran into on our machine may help someone else: - If no environment is selected, the cells do not run. Click the Python version at the bottom right and make sure the project's .venv environment is selected. - The Jupyter extension's native ZMQ module (ZeroMQ, a messaging library between processes) was crashing the extension host on this computer, with an "Extension host terminated unexpectedly" warning. As a fix we added "jupyter.disableZMQSupport": true to the settings and made the notebook package a development dependency. With this setting the kernel connected and the cells ran. If you do not see this problem, you do not need to add the setting. - If, after a VS Code version update, the interactive window gets stuck on "Connecting...", close VS Code completely, reopen it and run the cell again. These are our experience on a single computer; details may change as versions change.
AI helpers: the rules live in the project folder
We use AI tools while writing and debugging code, but real data never goes to any of them. Instead of leaving that to personal discipline, we write the rule into the project. The root of the project holds two files with the same content: CLAUDE.md (read by Claude Code) and .clinerules (read by Cline). They contain technology choices (Python 3.12, pandas 3, uv only), working rules (a test for every new function, ruff and pytest after writing code) and the data rule: real data is not sent to the cloud, cloud models see only code and synthetic or header-only examples, and if files with real data have to be read and summarised, that is done with a local model. The statistics rules are in the same files: check and state the assumptions, report the effect size and confidence interval together with the p value, use associational rather than causal language in observational designs, and confirm a final result by a second route before reporting it. Even when an AI tool follows these rules, checking the code and the numbers it produces remains the researcher's job. We run the local models on our own computer through Ollama, and the Cline extension can connect to them. We described how the models perform on our hardware in the previous article.
Positron or VS Code?
Both use the same project folder, the same .venv environment and the same code, so the choice is a matter of habit. Because Positron is designed for data science, the Variables, Data Explorer and Plots panes come ready-made. VS Code is very widespread, has a wide choice of extensions and may already be in use in your team; you build the same screens with extensions. We keep both open: you can start a piece of work in one and carry on in the other, because the files and the environment are shared.
Limits, and what comes next
This setup is a working environment, not an analysis method; method decisions, assumption checks and interpretation remain with the researcher. The example project was tried with the synthetic data shown here, on a single Windows computer; with your own data we recommend confirming the results by a second route. We plan to describe the workflow in R and RStudio in a separate article. If you would like help setting up something similar on your own computer, or adapting your current workflow to it, you are welcome to write to us.
Resources
Visual Studio Code: https://code.visualstudio.com Jupyter support in VS Code: https://code.visualstudio.com/docs/datascience/jupyter-notebooks uv: https://docs.astral.sh/uv/ Ruff: https://docs.astral.sh/ruff/ Previous article: a step-by-step Positron workflow (Blog, article 26)