A Local Python Data Analysis Setup: A Step-by-Step Positron Workflow
A Python data analysis routine where the data never leaves your own computer: an environment built with uv, cell-by-cell work in Positron, small tests, and local AI models. Every example uses synthetic data, and the post shows each step with screenshots.
What problem does this setup solve?
The same things cost time in thesis and article analyses again and again: not knowing which file is the latest version, not remembering which step a number came from, and not being sure who can see the data. The setup in this article addresses all three. The data and the analysis code stay on your own computer, every step lives in its own cell so it can be traced, and small tests check that the helper functions work. The working environment is Positron. Positron is a data science focused integrated development environment (IDE) for Python and R, built by Posit. It is based on the open source core of Visual Studio Code and shows variables, plots and tables next to the code in one window. The examples below use entirely synthetic (made-up) data; the numbers carry no scientific meaning, and the aim is only to show the workflow.
Step 1: Set up the Python environment with uv
uv is a fast command line tool that manages the Python version, the packages and the project environment in one place. Install uv first by following the official instructions (docs.astral.sh/uv), then run the commands below. The packages go into the project's own .venv folder, so other Python installations on your computer are left alone. pandas provides data tables, pyarrow and openpyxl provide fast file reading and writing and Excel support, matplotlib draws the plots, and scipy, statsmodels and pingouin provide the statistical tests. ruff is a code checker, pytest is the test runner, and ipykernel is the kernel that runs Positron's Python session.
uv python install 3.12
uv init veri-analizi
cd veri-analizi
uv add pandas pyarrow openpyxl matplotlib scipy statsmodels pingouin
uv add --dev ruff pytest ipykernel
Step 2: Open the folder in Positron
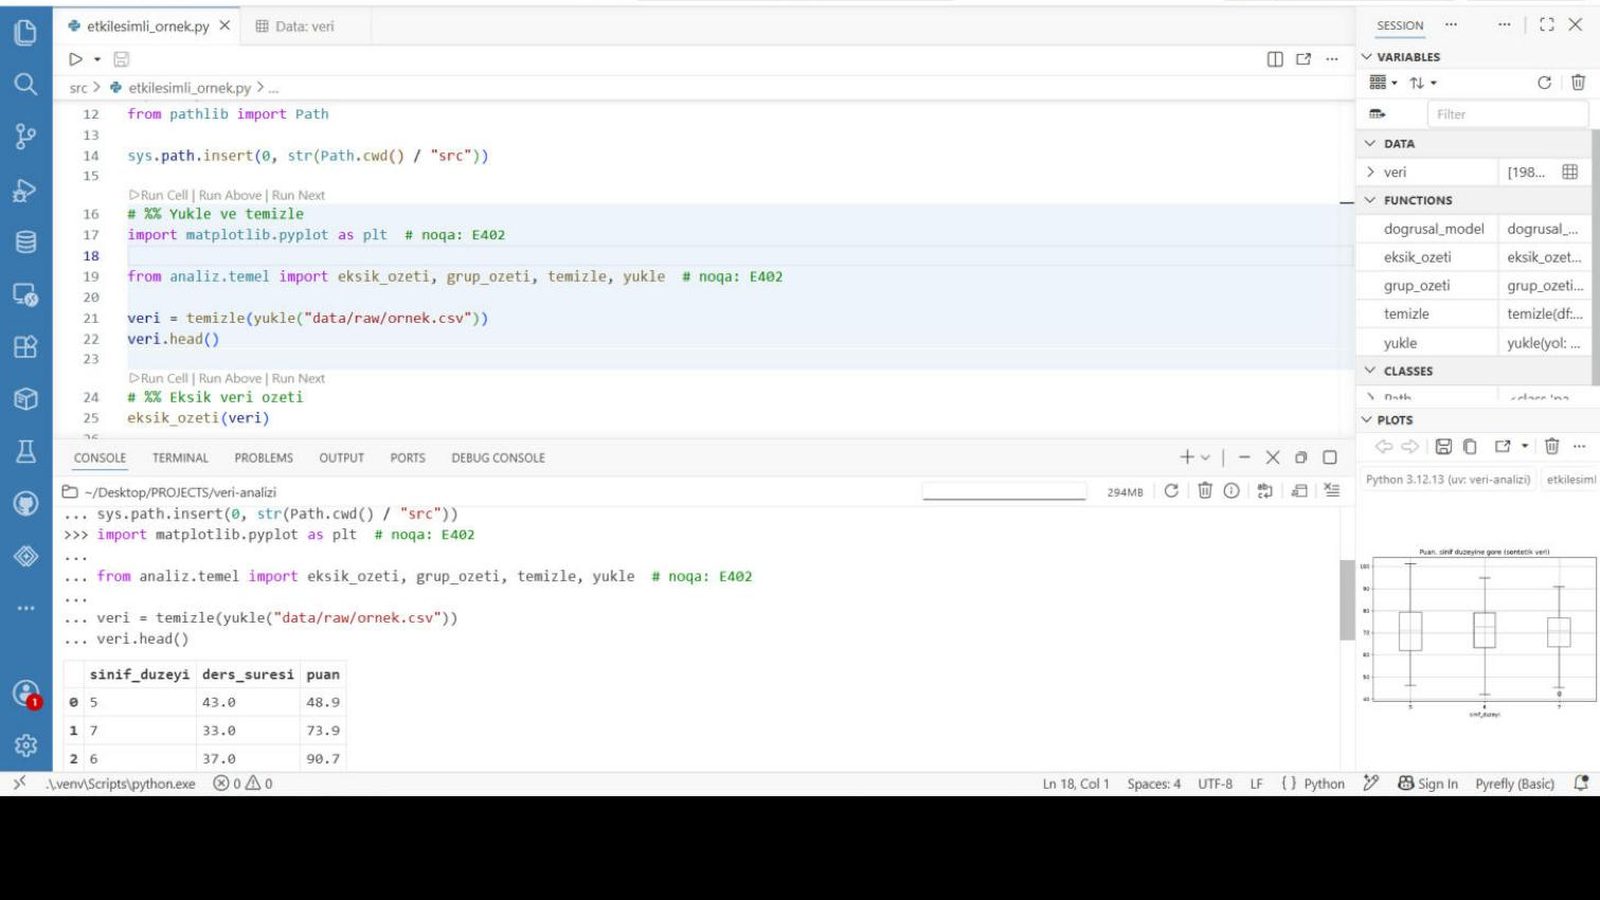
In Positron, use File, then Open Folder, and choose the project folder. Positron finds the .venv environment in that folder by itself; in the interpreter picker at the top right you will see a label such as "Python 3.12 (uv: veri-analizi)". If the label is different, click the picker and select the project's .venv environment by hand. After a moment the Console at the bottom and the Variables and Plots panes on the right start to fill.
Step 3: Run the code cell by cell
In the file, every line that starts with # %% opens a new cell. The Run Cell link that appears above a cell runs only that block, and the result shows up in the console right away. Loading, cleaning, summarising and plotting each live in their own cell, so when you change one step you do not have to rerun the whole script. In the example file, the first cell loads and cleans the data, the second produces a missing data summary and the third draws a plot.
Step 4: Look at variables, plots and tables together
The most useful part of Positron is that you see results while you write code. The Variables pane lists the data tables, functions and variables in the session. If you click the table icon next to a data table, the Data Explorer opens: it shows the number of rows and columns, each column's type, a small distribution summary and the percentage of missing values, and you can sort and filter by column. The Plots pane keeps a history of the plots you draw, and you can save or copy them.
Step 5: Run a small model
In the example project the statistics functions sit in a separate module. Here, a function is called that examines the association between lesson duration and grade level on the one hand and score on the other, using a linear model. The model is fitted with ordinary least squares (OLS), and the standard errors are computed in a way that is robust to unequal variances (HC3, heteroskedasticity-consistent standard errors, type 3). The output table gives the coefficient, standard error, t and p values, and the 95 percent confidence interval (gk_alt and gk_ust are the lower and upper limits). Because the data is made up, these results say nothing; they are here only to show the flow. When we interpret such output in a real study, we speak of associations, not causation: finding an association between lesson duration and score does not mean that duration changes the score.
Step 6: Tests and code checks
A silent error in analysis code is more dangerous than a visible one, because the numbers look plausible. That is why we write pytest tests for each helper function, using small examples whose answer is known in advance. Ruff scans the code for style problems and likely mistakes. After changing a function, both commands are run; if the tests do not pass, the analysis is not repeated.
uv run pytest
uv run ruff check
Local AI models, and why we chose them
We use AI models while writing and debugging code, but real data never goes to any of them. The local models run on our own computer through Ollama. The hardware decided the choice: an Intel Core Ultra 9 275HX processor (24 cores), 31 GB (gigabytes) of RAM (random access memory) and an RTX 5070 laptop graphics card (GPU, graphics processing unit) with 8 GB of VRAM (video random access memory). - Qwen3 8B (8 billion parameters): The model fits entirely in 8 GB of graphics memory. In our own quick test it produced about 50 tokens (pieces of text) per second, a comfortable speed for everyday coding help. - Qwen3 14B (14 billion parameters): It does not fully fit in memory, so the work is split between the graphics card and the processor, giving about 8 to 12 tokens per second. It is slower, but worth trying for questions that need longer reasoning. - Claude: We use it through Claude Code, only with code and synthetic examples. These speeds come from a short test on this machine and are not a benchmark; they may differ on your hardware.
Why does the data stay on the computer?
Real data is processed only on the computer you work on. When you ask a model a question, code and synthetic examples are shared, and real rows are not. Watch out for error messages: some of them include the values that caused the error. Before pasting a message into an AI tool, check whether it contains a real value. If your study depends on ethics committee approval or a data sharing agreement, decide which tool may process the data, and where, according to those conditions.
Limits, and what comes next
This setup is a working environment, not an analysis method; method decisions, assumption checks and interpretation remain with the researcher. The example project was tried with the synthetic data shown here, and with your own data we recommend confirming the results by a second route. We will describe the workflow in R and RStudio in a separate article when time allows. If you would like help setting up something similar on your own computer, or adapting your workflow to it, you are welcome to write to us.
Resources
Positron: https://positron.posit.co uv: https://docs.astral.sh/uv/ Ollama: https://ollama.com